Predicting the Price of Bitcoin (Part 2): If This Doesn’t Make You Want to Buy More Bitcoin, Nothing Will

(Note: Part I is here)
Why does the price of bitcoin keep going up? One good explanation is that fewer and fewer bitcoins are hitting the market.
Eighteen hundred new bitcoins are generated each day to feed the miners that safeguard the bitcoin network. But that hasn’t always been the case.
Every 210,000 blocks, the reward is cut in half. This on average takes a bit less than 4 years.
Until late 2012, the bitcoin algorithm allowed for 6400 coins to be generated each day.
But then in November 28, 2012, production was cut to 3600 coins. At that time, the price of bitcoin was $12,22.
On July 9th 2016, production was cut to 1800 coins, and the price was $657.61.
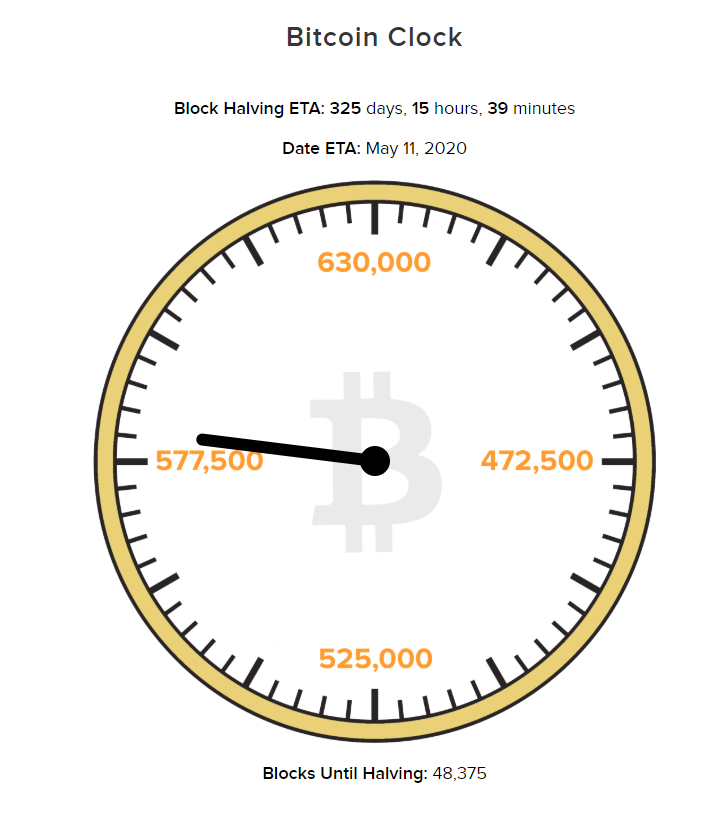
Finally, the next halving is expected to take place on May 11,2020:
Is there any evidence that halving events have any influence on the price of bitcoin?
If we look at historical monthly prices, the answer seems to be yes.
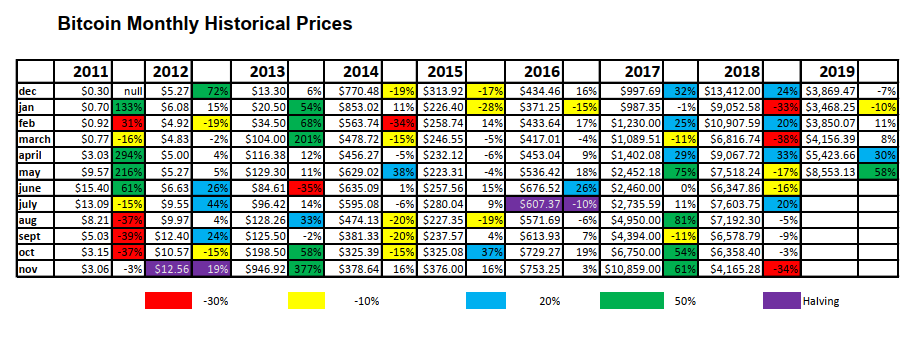
The purple highlights show the month in which the production of bitcoin was halved.
In the 12 months before the 2012 halving, bitcoin rose from $3.06 to $12.56 an increase of 410%.
In the 12 months after the 2012 halving, bitcoin rose from $12.56 to $946.92 an increase of 7537%.
In the 12 months before the 2016 halving, bitcoin rose from $280.04 to $607.37, an increase of 217%.
In the 12 months after the 2016 halving, bitcoin rose from $607.37 to $2734.59 an increase of 450%.
So far, so good. If we are holding bitcoin during those time periods, we are doing very well.
But what if we are holding bitcoin during the “dead” months when the halving events are nothing more than a distant memory, and the next halving event is more than a year away?
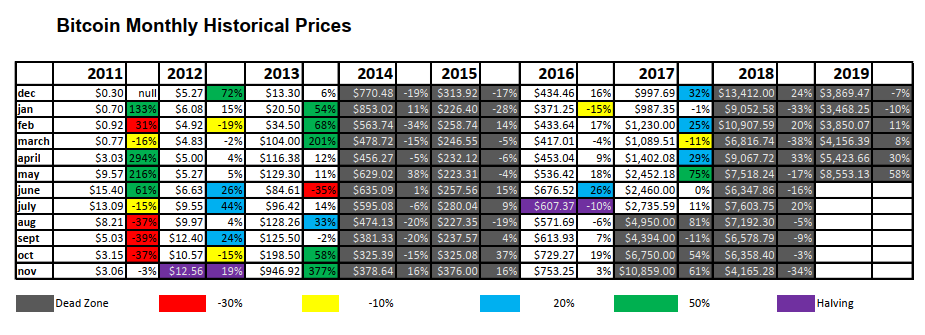
You will notice the first “dead” zone is comprised of 24 months while the second “dead” zone is only 22 months. That’s because we are just now entering the one year waiting period before the next “halving” event.
That is to say, because of the build out of bitcoin miners over the last few years, the time period between halving events is getting shorter.
In any case:
Price of bitcoin at the beginning of the 2014-2015 dead zone was $946.92, and at the end, $376, a decrease of 60%.
Price of bitcoin at the beginning of the 2017-2019 dead zone was $4950, and at the end, $8553.13, an increase of 72%.
These numbers are so shocking, we must ask ourselves, is that a true correlation or did we massage the data?
Absolutely, there are other factors that influenced the price of bitcoin in those time periods.
For example, the bankruptcy of Mt. Gox was the defining event that triggered the “crypto-winter” of 2014-2015 and lead to a huge price decline.
Secondly, two data points are not enough to give a conclusive answer with 100% reliability.
On the other hand, that’s all the data we have to work with, and it does cover a nine-year period.
To me, the most interesting pattern is that during the “dead” zones, there were eight separate times that the price of bitcoin dropped more than 30% in one month.
During the “happy” times, (one year before and one year after halving), the price of bitcoin dropped more than 30% only once.
Coincidence? I will let the reader be the judge.
But the data is suggesting that the good times are just starting to roll.
DJ