Earlier this month, trading signals commentators tweeted furiously of a possible 25% drop in the price of bitcoin.
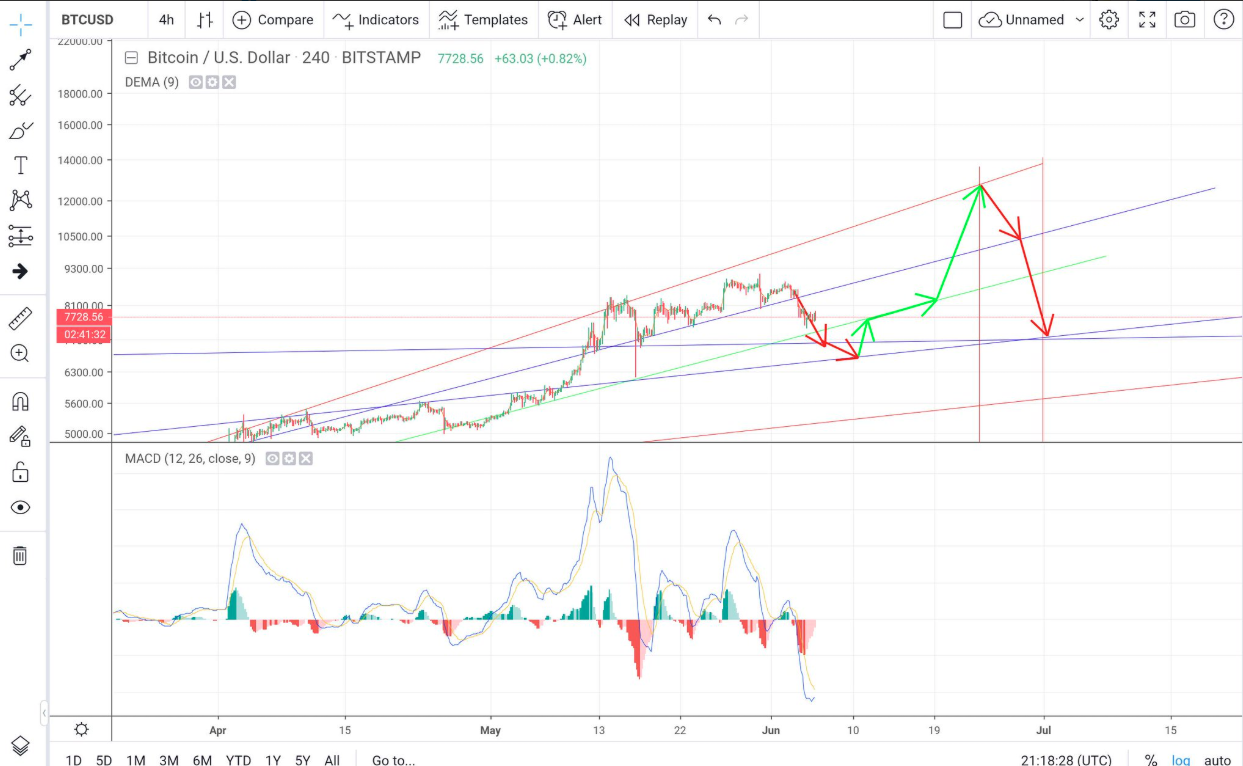
A random Bitcoin price prediction
So far, they are wrong. Again.
It is true that bitcoin dropped as much as 15% since the beginning of June.
But their models showing a drop to the 6000s now look to be very unlikely.
I am very skeptical of trading signals groupthink for one reason: their price predictions are based on historical data of equities and commodities over the last 50 years.
What’s wrong with that?
Bitcoin is a not a stock. It’s also not your average commodity. I don’t think historical data from other asset classes are useful in predicting the price of bitcoin.
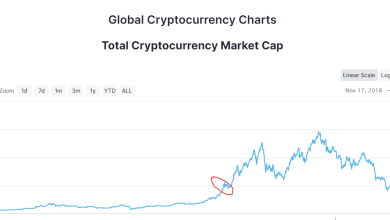
For example, in December 2011, bitcoin was $2.00. In December 2017, it briefly reached a high of $20,000.
In six years, that’s a price increase of 10,000%. There is no other stock or commodity in the history of finance that went up ten thousand percent in six years (at least none that I know of).
I could go on and on about the failure of popular trading systems to accurately forecast the price of bitcoin, but I would rather talk about my favorite method to predict bitcoin prices.
If you haven’t guessed it already, I look at the historical record of bitcoin, in this case the historical monthly record:
Historic $BTC prices for the month of June:
2012 +25.4%
2013 -21%
2014 -3.5%
2015 +26%
2016 +4%
2017 -7.8%
2018 -7.4%
2019 -7% (up to June 11th)
Bitcoin usually finishes the month of June is down slightly more than 50% of time. The worst June ever was 2013 with a drop of 21%.
If bitcoin were to drop to $6725 this month, that would be the worst June ever on record. I don’t think it’s going to happen.
Historically, bitcoin in the month of July performs better:
2012 42%
2013 13%
2014 -11%
2015 7.2%
2016 -9%
2017 7.8%
2018 19.5%
More than two-thirds of the time, bitcoin closes in July, and it’s worst July ever, it was only down about 11%.
If you look at historical month prices of bitcoin since 2011, some interesting patterns emerge:
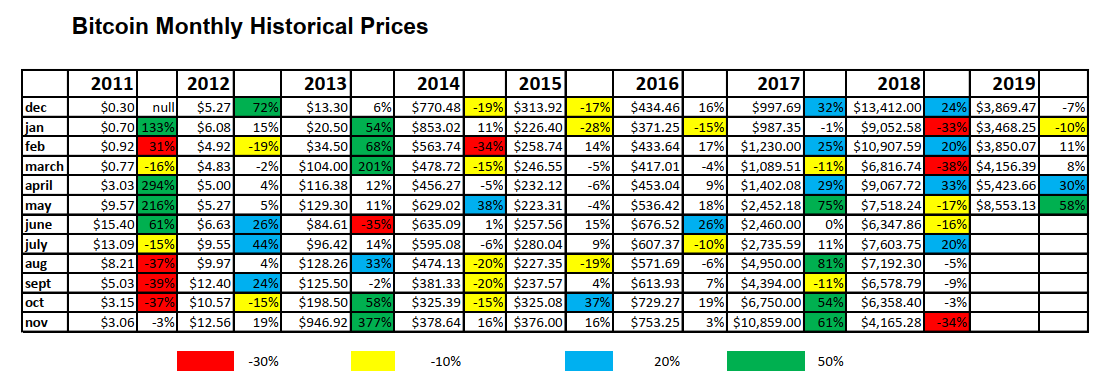
Right away you notice, that after 2011, red squares virtually disappear until 2018, when they appear three times in one year (Red means that bitcoin dropped more than 30% that month).
Excluding year 2011 (when it dropped 30% or more, four separate times) and year 2018 (had three bad months), there have been only TWO times when bitcoin dropped more than 30% in one calendar month.
Conclusion: Even by bitcoin standards, 2018 was a crazy-bad, volatile year that probably won’t be repeated anytime soon.
Another interesting pattern is again, excluding 2011, that good months outnumber bad months.
But, considering the price appreciation of bitcoin over the last decade, you would think good months would SIGNIFICANTLY outnumber the bad months.
However, they don’t.
From 2012 to beginning of June 2019:
Months in which bitcoin increased more than 50%: 11
Months in which bitcoin increased more than 20% but less than 50%: 15
Months in which bitcoin went down more than 30%: 5
Months in which bitcoin went down more than 10% but less than 30%: 17
Therefore, in a period of 90 months , bitcoin went up 20% or more, about 29% of the time.
But bitcoin also has a 24% chance of dropping 10% or more in any given month.
Note: the threshold for gains is higher than the threshold for losses. One, an investor must always have higher gains than losses in a high-volatility environment just to break even.
If you don’t believe me, whip out your calculator, punch in 100 and times it by 1.2. Then times the value by 0.8. Do that a couple of times and you will see what I mean.
Finally, there is a THIRD pattern that is somewhat interesting. Do you see any months where bitcoin tends to rise or fall?
There is only ONE month where bitcoin failed to rise by more than 30% and that is October.
There are four months where bitcoin has never declined by more than 30%: December, April, May and July.
Interestingly, excluding June 2013 (when bitcoin declined by 35%), the months of April through to end of July, look to be the “safest” time to invest in bitcoin.
Conclusion
I have found looking at historical monthly prices of bitcoin to be the most useful predictor of future bitcoin prices, at the very least a useful predictor of bitcoin volatility.
My prediction for the summer? Happy times for the rest of June and July, with excitement (either positive or negative) returning to the market in August.
DJ
Editor’s Note: Stay tuned for my next article on predicting the price of bitcoin. Also, have you checked out my hedging training course? If you are not a US resident, you may find it’s exactly what you are looking for.