I don’t really like technical analysis or trying to make price predictions by looking at charts. The human eye sees patterns in chaos.
The world of investing is more random than most people believe, and more prone to chance than most financial newsletter writers would care to admit.
Having said that, the chart below, of the price of Bitcoin since 2014, is hard to ignore.
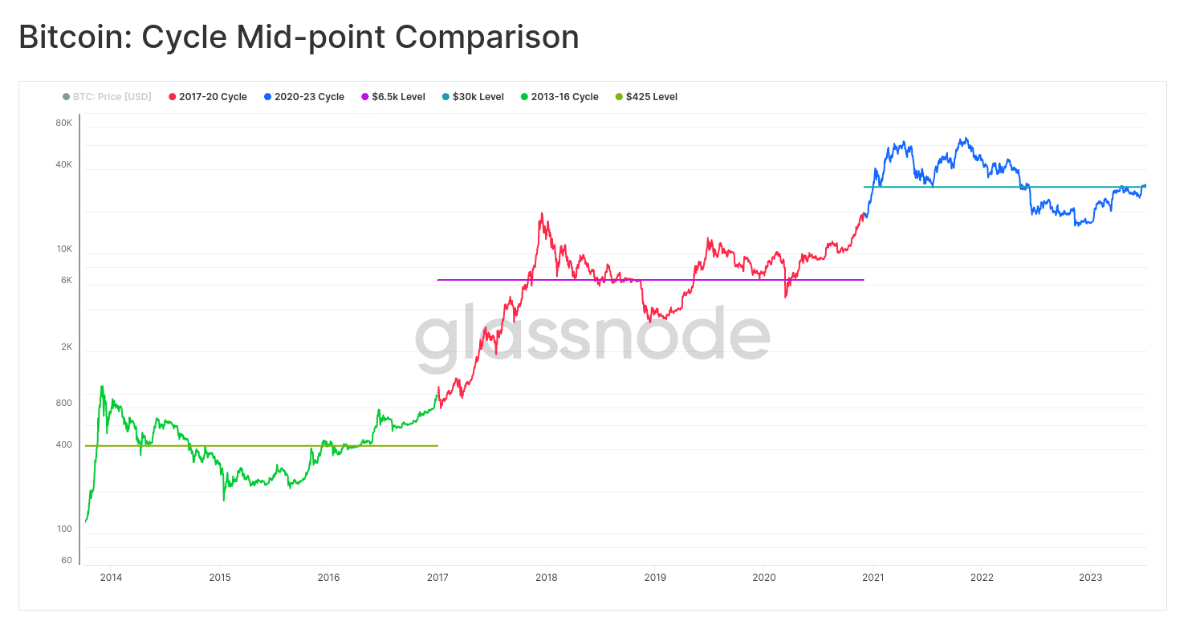
https://insights.glassnode.
According to Glassnode, the first equilibrium point of Bitcoin, from 2014 to 2017, was $425. The second equilibrium point, starting in 2018, was $6500.
And now we are stuck around $30K.
Note that the gyrations of the first cycle and third cycle are remarkably similar.
The good news is that this chart predicts we have nowhere to go but up. The bad news is that we can expect to wait until 2024 to see some real price appreciation.
However, keep one in mind. The scales on this chart are logarithmic, so variance about the equilibrium is visually understated.
When COVID first hit in 2020, and the price of Bitcoin briefly dumped to $3000, nobody was saying “Oh don’t worry, the price will be going back up in no time because the equilibrium point is $6500.”
Conversely, when Bitcoin broke through $60K in 2021, most people myself included thought it a foregone conclusion it would break $100K in that cycle. But it didn’t.
Measuring peak-to-peak, the last Bitcoin super cycle was somewhat disappointing. Bitcoin peaked around $20K in late 2017 and the ATH in 2013 was $1242. It went up 1500%!
But in the last super cycle, the peak was $67K. That’s only a 235% gain.
However, if we look at the equilibrium points, it looks a bit better. In the 2017 super cycle, Bitcoin appreciated 1430% and in 2022, it appreciated 360%.
What Will Happen in the Next Two Years?
With a US court ruling today that the Ripple token is not a security, the odds are heavily in favour that a Bitcoin ETF will be approved in September.
What a difference a few months makes. In the first quarter of this year, US banking regulators were shutting down banks that dared to have cryptocurrency exchanges as their customers.
And then we had SEC suing Coinbase and Binance, saying the exchanges were illegally selling securities.
Today’s ruling has blown a rather large hole in the SEC arguments.
But back the price of Bitcoin. What are we predicting to be the next ATH and the next equilibrium point?
My opinion is the last super cycle was disappointing because too many grifters (like FTX) and Ponzi schemes (like Terra Luna) spoiled the soup.
This time we can hope that the market is a little more wiser and US regulators are a little savvier in nailing the true crooks in crypto (of which we have more than our fair share).
I think the next ATH is at least $157,000 with an equilibrium point above $100K.
That’s a conservative take. An aggressive take is Bitcoin matches the market cap of gold.
All the gold in the world is worth $13 trillion. The current market cap of Bitcoin is $607 billion.
Okay, Bitcoin at $600k is a bit of reach. We might have to wait for 2030 to hit that number.
Does the chart really predict the price of Bitcoin, no matter what happens in the “real world”? I guess we will see in the next year or two.
One thing is for sure. Nobody is calling for sub $20K Bitcoin anymore. The bottom is in.
DJ