Who still has money left in the market? I don’t have much anymore.
I bought some crypto at the beginning of February. This month is usually good for crypto. But Putin put an end to that.
I don’t play the chart, I play the calendar. And March is traditionally bad.
And history doesn’t repeat, but it rhymes.
Most investors in crypto are under the age of thirty. So they don’t have any experience of how the market trade during a serious military conflict (Iraq war of 2003) or a market crash (the last one was in 2008).
And now we have both potentially happening this quarter. It’s going to be an education.
You can learn from experience or from history. The former charges higher tuition.
Examining past stock market crashes will help us to know what is going to happen in the future, maybe as soon as next month.
In the last 50 years, there have been four significant stock market crashes: 1973, 1987, 2001, 2008.
You could write a book on each of these crashes (and people have) but I’m not a novelist, I’m a trader.
Keeping it short, we are looking for the answers to three questions:
1. How bad was it?
2. What were the warning signs?
3. How long did it last (i.e., when is it safe to go back in)?
That Seventies Crash
“In the 694 days between 11 January 1973 and 6 December 1974, the New York Stock Exchange’s Dow Jones Industrial Average benchmark suffered the seventh-worst bear market in its history, losing over 45% of its value.
1972 had been a good year for the DJIA, with gains of 15% in the twelve months. 1973 had been expected to be even better, with Time magazine reporting just 3 days before the crash began that it was ‘shaping up as a gilt-edged year’.
In the two years from 1972 to 1974, the American economy slowed from 7.2% real GDP growth to −2.1% contraction, while inflation (by CPI) jumped from 3.4% in 1972 to 12.3% in 1974.”
Wikipedia
Outside of the US, other exchanges had it even worse. The London stock exchange FT 30 went down 73%. The Hong Kong Hang Seng Index dropped from 1000 to 200 (80% drop).
Having been a crypto-investor for five years now, an 45% correction is nothing to sweat over (I count at least six since 2017). It’s the 70% to 85% corrections that kill you.
It bears repeating: in 1973, New York went down almost 50%, but London went down 70% and Hong Kong went down 80%.
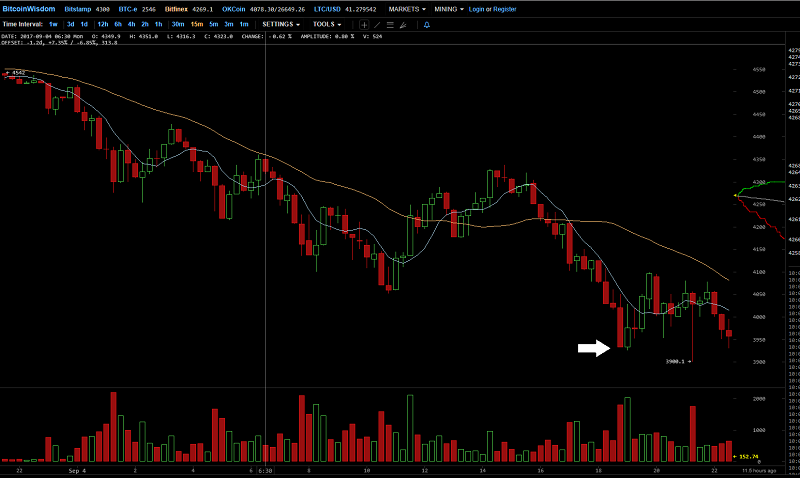
Let’s pretend at the present time, New York is now NASDAQ, bitcoin is London and Ethereum is Hong Kong.
A 70% drop in the price of bitcoin from all-time high means we see $20,000. An 80% price drop in Ethereum from the all-time high means we see $950.
Right now, bitcoin is trading at $38,000 and Ethereum is at $2600.
History says we still have room to drop.
Warning Signs
You would think with the 1970s stock market crash, the warning sign was “inflation.” but you would be wrong. In the early 1970s, inflation was declining and only trended up AFTER the crash:
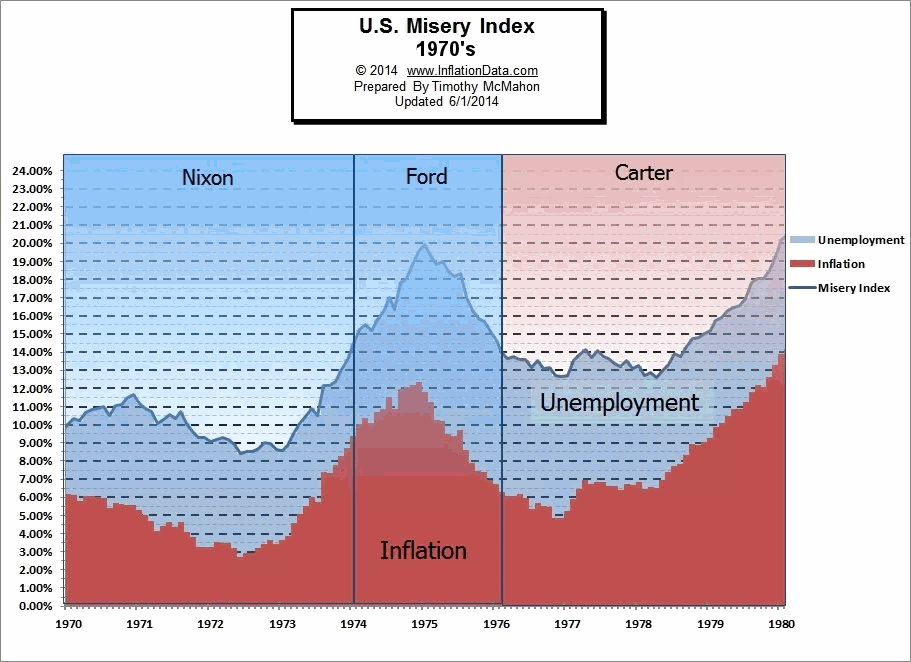
Just kidding. You were right, it was inflation.
Nixon imposed price controls in 1971 that suppressed inflation, but only for a short time. When price controls were lifted, the infamous “Nixon” shock occurred and inflation skyrocketed.
The market saw what was going to happen and acted accordingly.
Of course, with every stock market crash, there are huge debates over what “really caused it.”
In the early 1970s, there were a lot of suspects: the OPEC oil embargo, collapse of the Bretton Woods agreement, the devaluation of the dollars, the agony of the Vietnam War, and the Watergate scandal.
What is beyond dispute is that the first half of the seventies just really, really sucked lemons, and its no wonder the stock market took a crash.
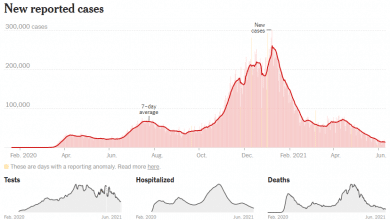
Have the COVID years of 2020-2022 been as bad as 1971-1973? I would say at least it’s a contest.
How Long Did It Last?
About two years, then after the crash the Dow Jones spiked upward:
https://leduc998.wordpress.com/2008/05/23/dow-jones-1970-1979/
It’s not true that for most of the seventies, the stock market went into the tank. It went up, it went down. There was lots of opportunities for a canny trader to make money.
But I’m more interested in what happened to the Hang Seng Index, because I think it’s a better historical comparison to crypto today:
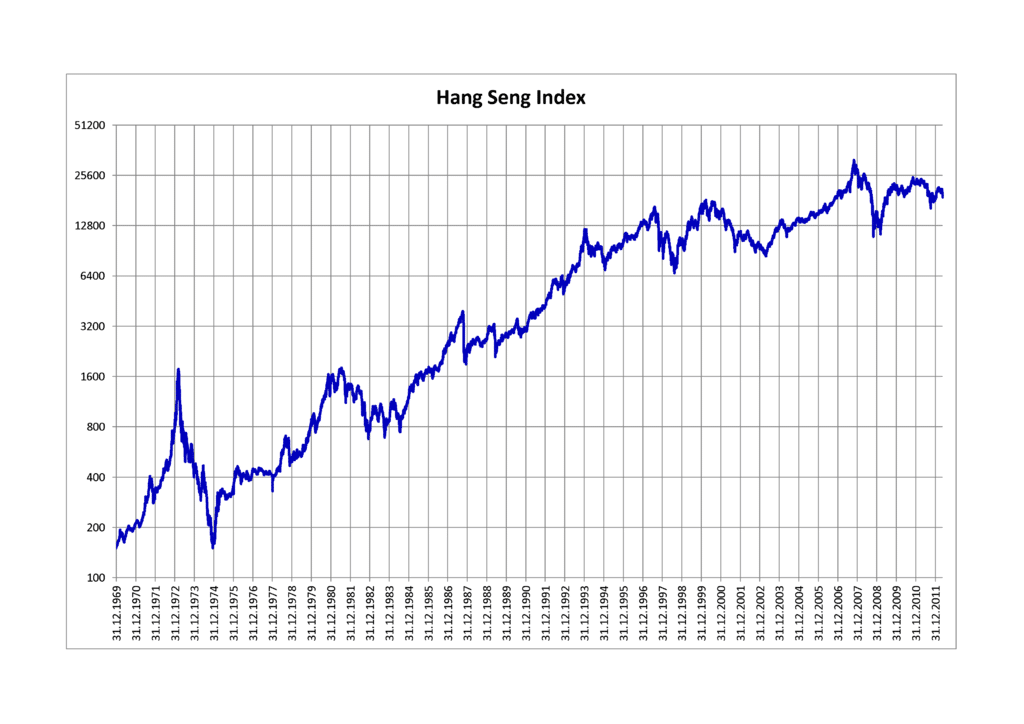
A beautiful chart…after the crash.
The DJIA bounced around for much of the 1970s, but after the 80% correction, the Hang Seng was good to go for almost ten years before another serious correction.
It went from below 200 to 1600 in 1980, an average compound return of 30% in eight years.
Since 2013, bitcoin has gone from $1100 to $38,000 an average compound return of 55%.
Conclusion
For me, the parallels between the stock market turmoil of 1973-74 and today are striking.
Inflation pressures, denial by the US financial authorities that inflation is a problem until it’s too late, and a whole bunch of lousy geopolitical problems screwing up the economy (hello COVID and supply-chain issues.).
But do we have to wait two years for things to shake out?
I don’t think so. I think markets correct WAY faster than they do 50 years ago.
My future article on stock market crashes that come later will prove that.
DJ